


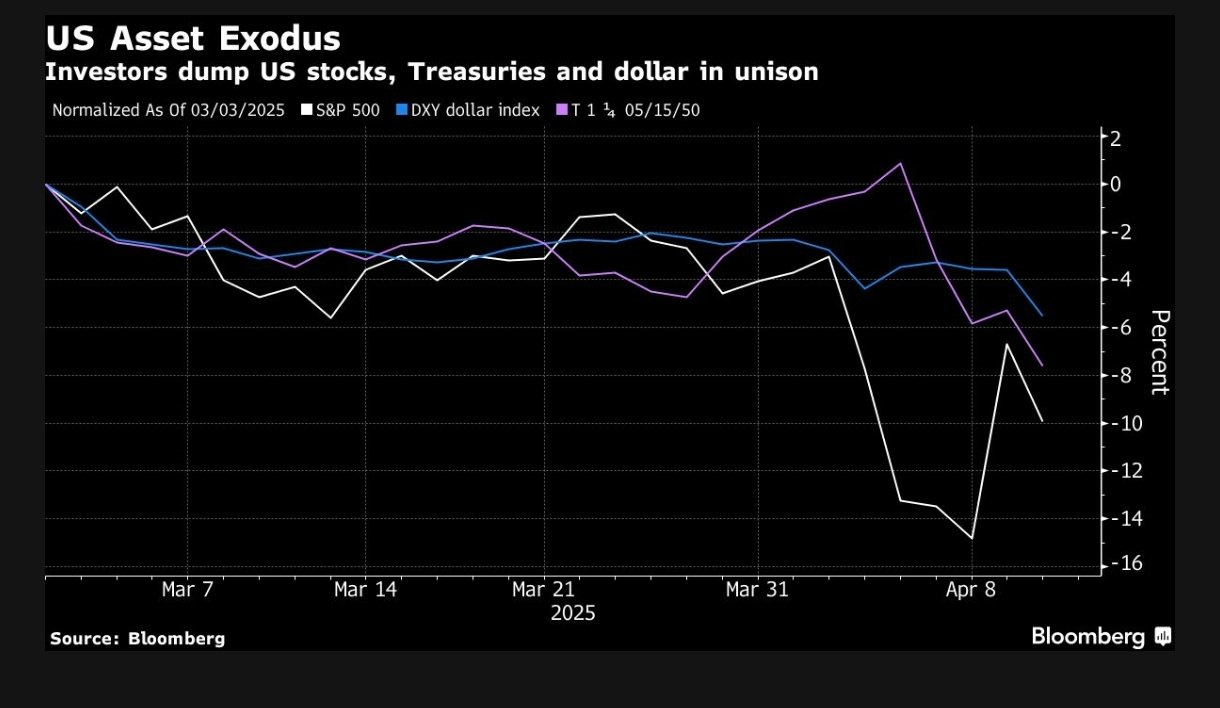
We had a historical week as the world’s largest economy lost trust among global investors and, as a result, witnessed a capital flight worth billions of dollars.
Yes, folks, the US had an “Emerging Market” (EM)-style crisis in which its currency (the greenback), bonds, and stock markets fell in tandem, triggering massive rotation in alternate safe-haven assets like CHF, Gold, JPY and even EUR.
As we reach an unprecedented trade embargo between China and the US, investors and traders encounter mind-boggling volatility across assets.
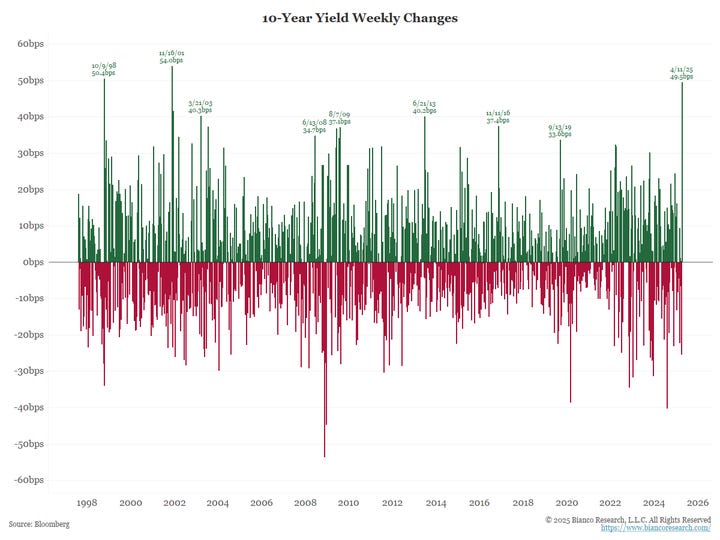
Furthermore, we saw several decades-old records smashed in bond markets this week:
The 30Y UST saw its largest move since 1982.
The 10Y saw a monstrous move of 51 bps, the largest since 2001.

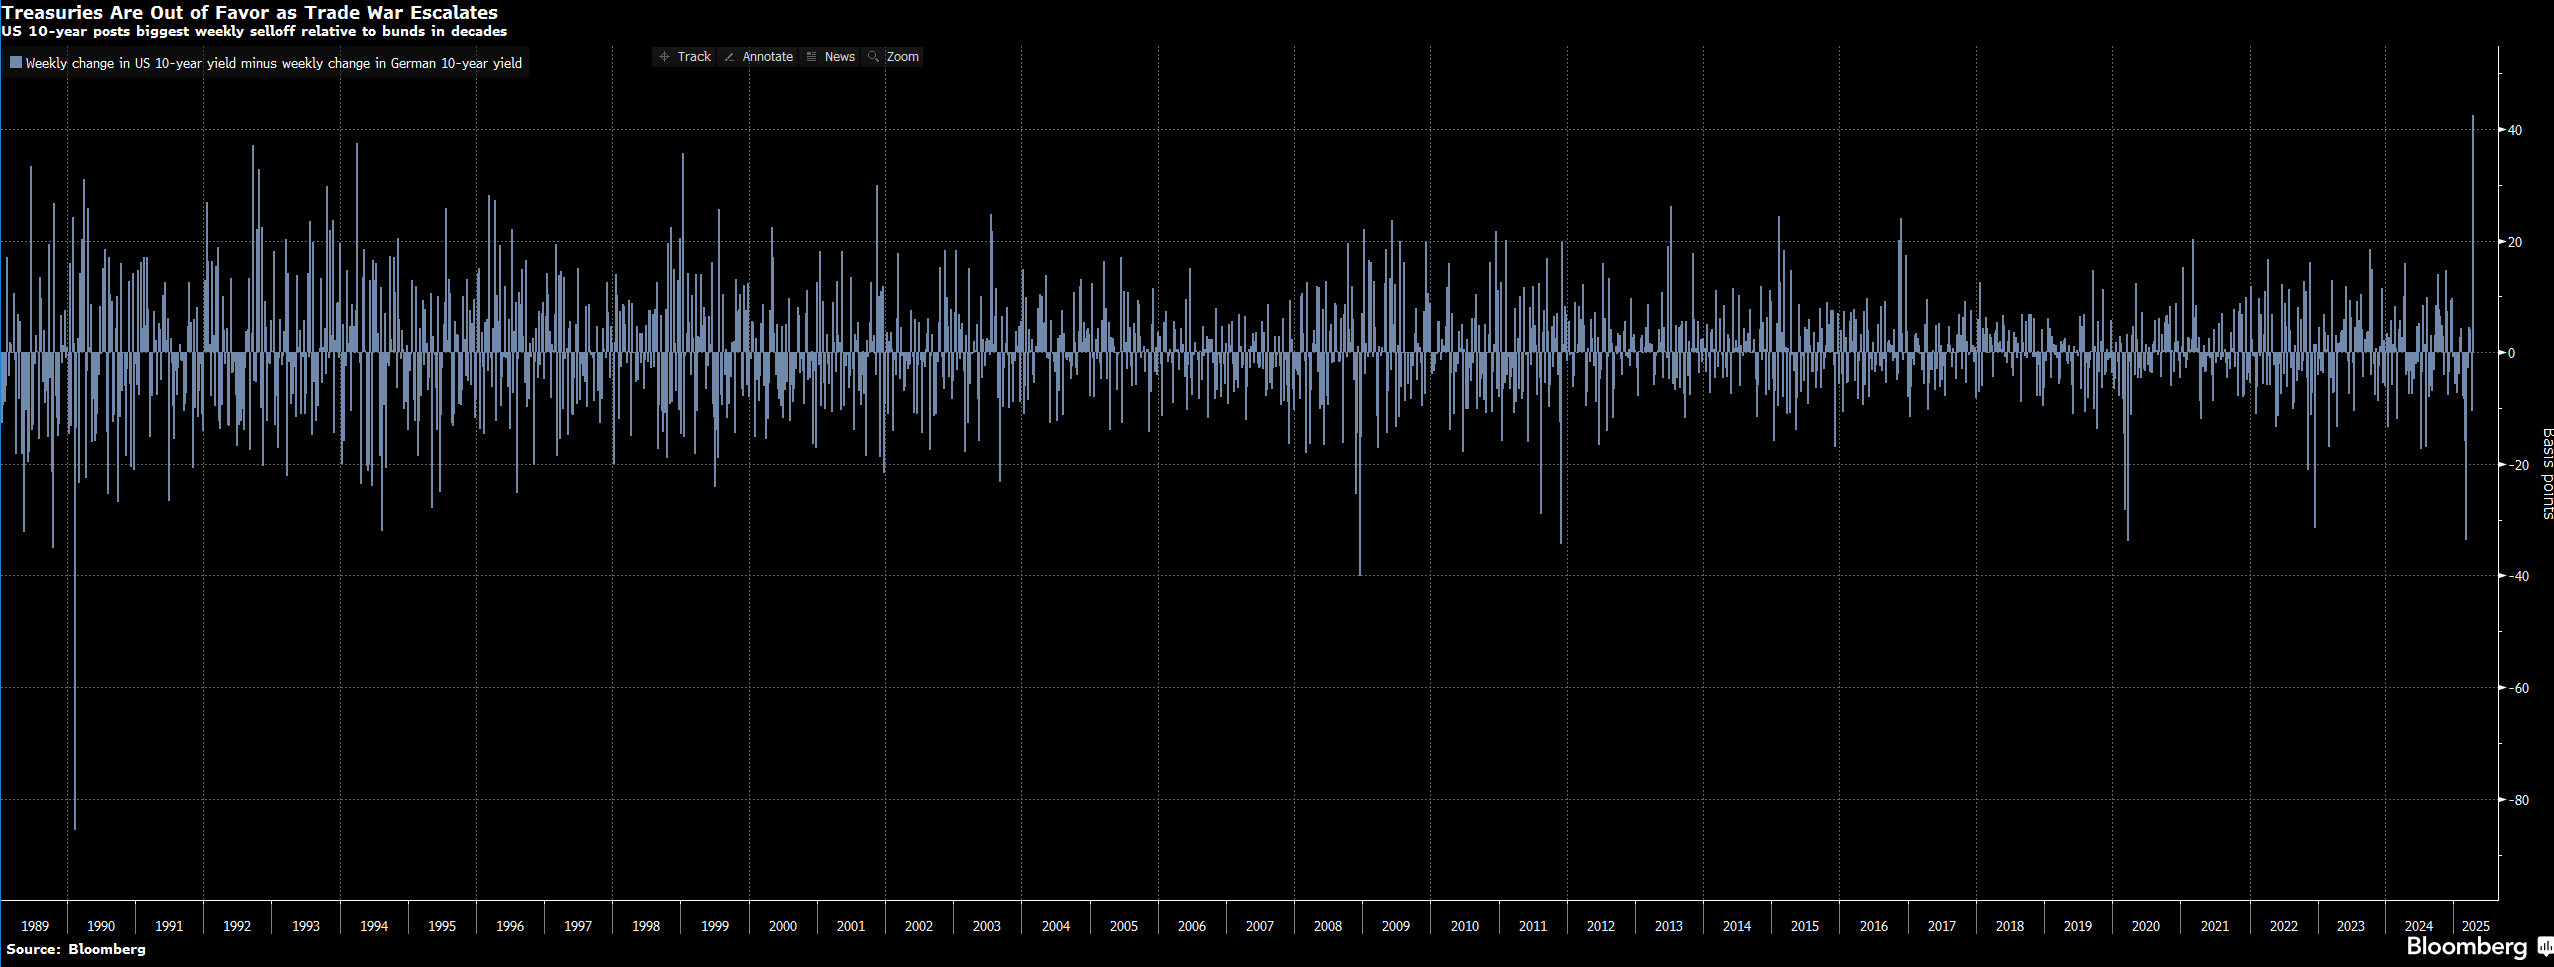
Source: Bianco Research It was the worst week for US Treasuries against the German Bunds. In other words, capital moved from the world’s largest bond market to the European bond markets at the fastest pace on record.

Source: Bloomberg
It was not only the bond markets that imploded. At one point, we were on the verge of a lower circuit on stocks in the US, with the NDX down around 7% on Thursday.
Despite extreme volatility, we ended the week on a positive note with a weekly return of 5.7% for the S&P 500.
Amid the trade war and heart-wrenching cross-asset volatility, we received the all-important macro data from the US this week, which eased fears about the inflationary spike (before the tariff impact).
Let’s understand the global macro data and the wild cross-asset moves with charts (total 30+ charts).
US/FX/ Gold/ Oil!
We got really good news on the macro front with softer-than-expected CPI and PPI data.
However, the markets ignored the incoming data as Trump was embroiled in the tariff war.
PPI surprised on the downside as lower energy prices finally reflected in the data.
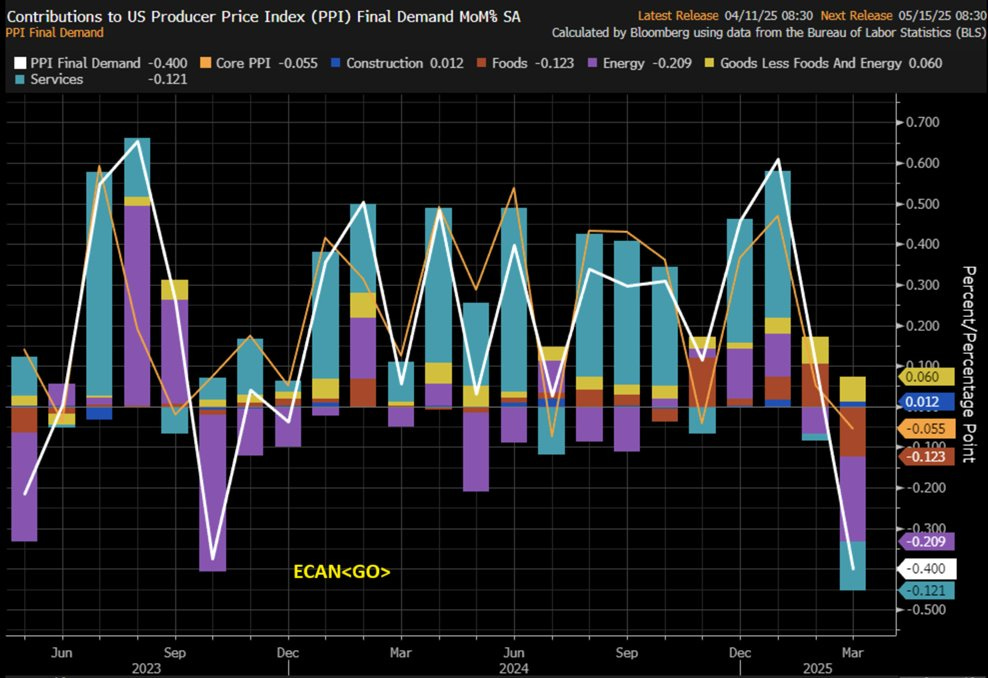
Furthermore, surprisingly, core services also had a big negative surprise, igniting fears that the economy is faltering as the negative wealth effect (due to lower stock prices) takes a toll on the demand for services.
JayPo’s favourite inflation measure (post-COVID), the Supercore CPI or the Services Ex-Housing, threw an absolute shocker.
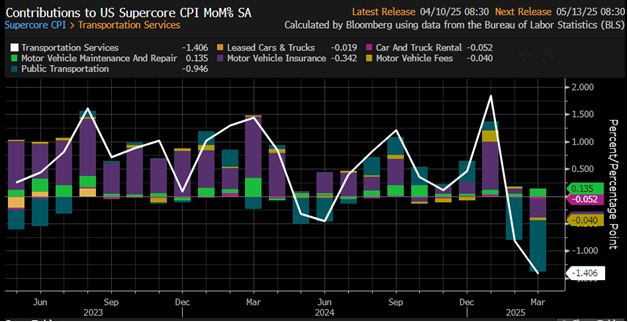
We saw a MoM -0.243% decline in Supercore CPI, led by transportation services (airfares majorly). Furthermore, most components were red except Motor Vehicle Maintenance and Repair.
The headline index came in at -0.1% MoM v/s expectations of 0.1%.
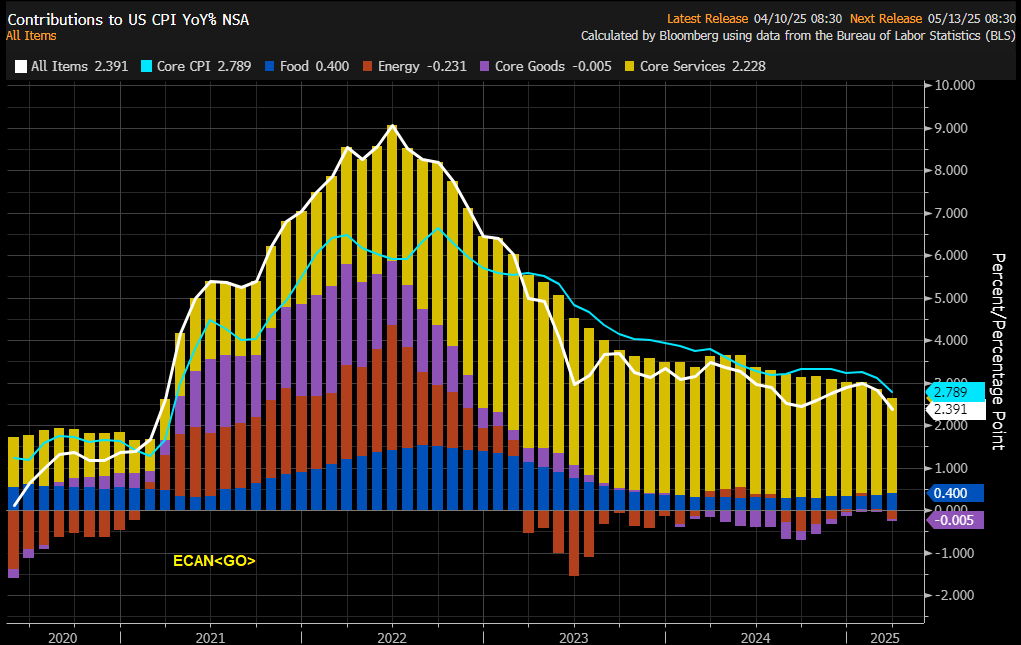
Furthermore, the Core CPI was 2.8% YoY or below 3% YoY for the first time in two years.
Nonetheless, the impact of tariffs will be felt in further readings, and core goods inflation will likely inch up in the coming months as businesses can’t absorb the shock entirely.
Thus, we believe that MoM inflation by July can print..
Keep reading with a 7-day free trial
Subscribe to Marquee Finance by Sagar to keep reading this post and get 7 days of free access to the full post archives.