


Month In Charts: April 2025!

April 2025 was one of the wildest months ever in the history of equity markets in the US.
Why?
“The S&P 500 finished the month down 0.76% after seeing an 11.2% MTD drop on 4/8 and an 11.8% rally from that point through today's close. This was the closest we've gotten to getting back to even in a month that saw a 10%+ drop since 1952 when the 5-day trading week began.”
Not only in the equity markets, but the cross-asset moves were extremely volatile as records were shattered in the FX, bond and Precious Metals.
Let’s understand what transpired in global financial markets in “Wild Wild” April with the help of 13 charts!
The “manic” April saw an enormous sell-off in US assets (dollar, stocks and bonds) as Liberation Day shocked the whole world. Furthermore, the ensuing trade war with China meant the markets remained jittery. However, as we ended the month, there was a swift recovery across bonds and equities.
Nonetheless, YTD, US equity markets remain the worst performers. Due to the chaotic environment, Gold remains the top performer, with Latam equities (represented by Brazil—EWZ here) and Europe stark outperformers in the equity universe.
Commodities have begun to underperform as we ended the month on rising “global” recession fears.


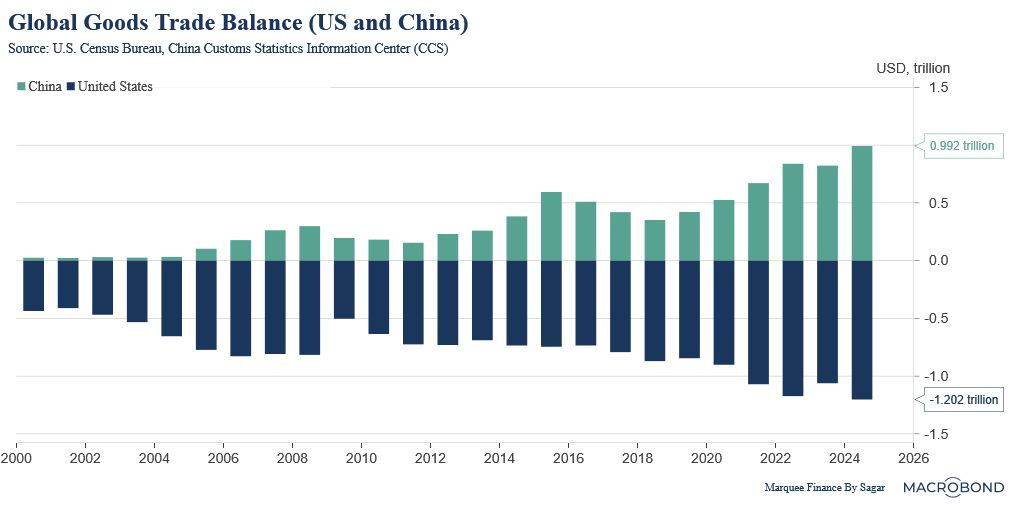
Let's understand the global trade dynamics since it was all about trade and deficits in April.
While the US has an annual trade deficit of $1.2 trillion, China has a trade surplus of around $1 trillion. Trump/the US cannot reduce the deficits overnight, and the US needs a long-term “sustainable” plan to normalise the deficits (as a percentage of GDP) if it wants to solve the problem of twin deficits.

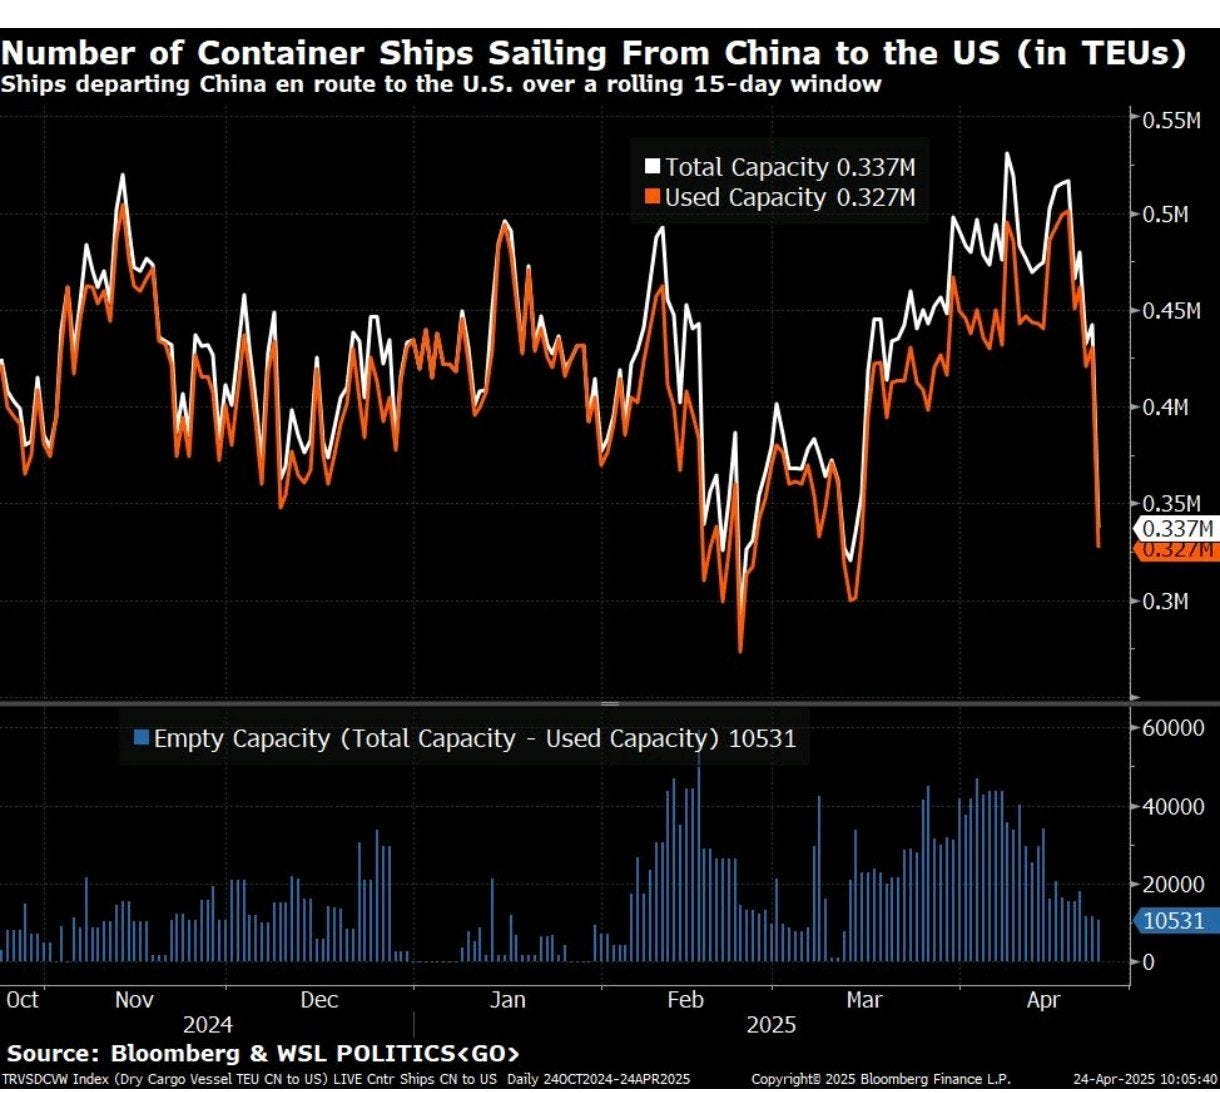
Due to the US embargo on China (imposing 145% tariffs), the number of container ships sailing from China to the US has plunged, and if the status quo is maintained, we will experience a repeat of COVID-19.
The US will be facing shortages of unprecedented magnitude earliest by June.
Thus, a trade deal is the need of the hour to avoid bankruptcies and shortages in the US.

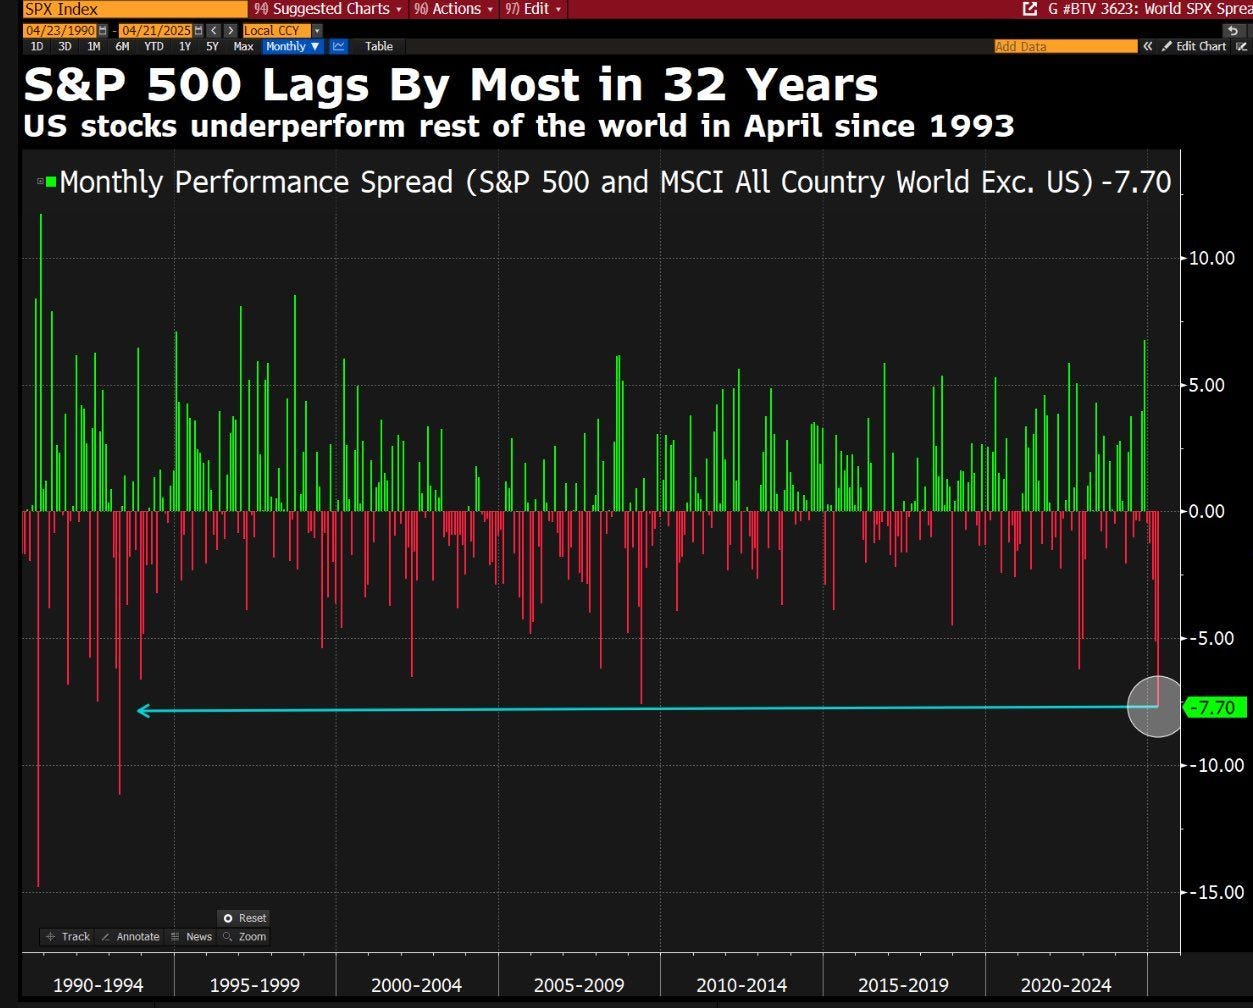
Well, the world's largest equity market underperformed the MSCI All Country World Ex-US Index by the most in 32 years.
Yes, you read it right. 32 years it is!After sheer outperformance due to the narrative of "US Exceptionalism" in late Q4 last year, the US equity markets got a reality check as sky-high valuations and risks of a slowing economy due to The Great Tariff Shock,™ result in a drawdown greater than other equity markets.

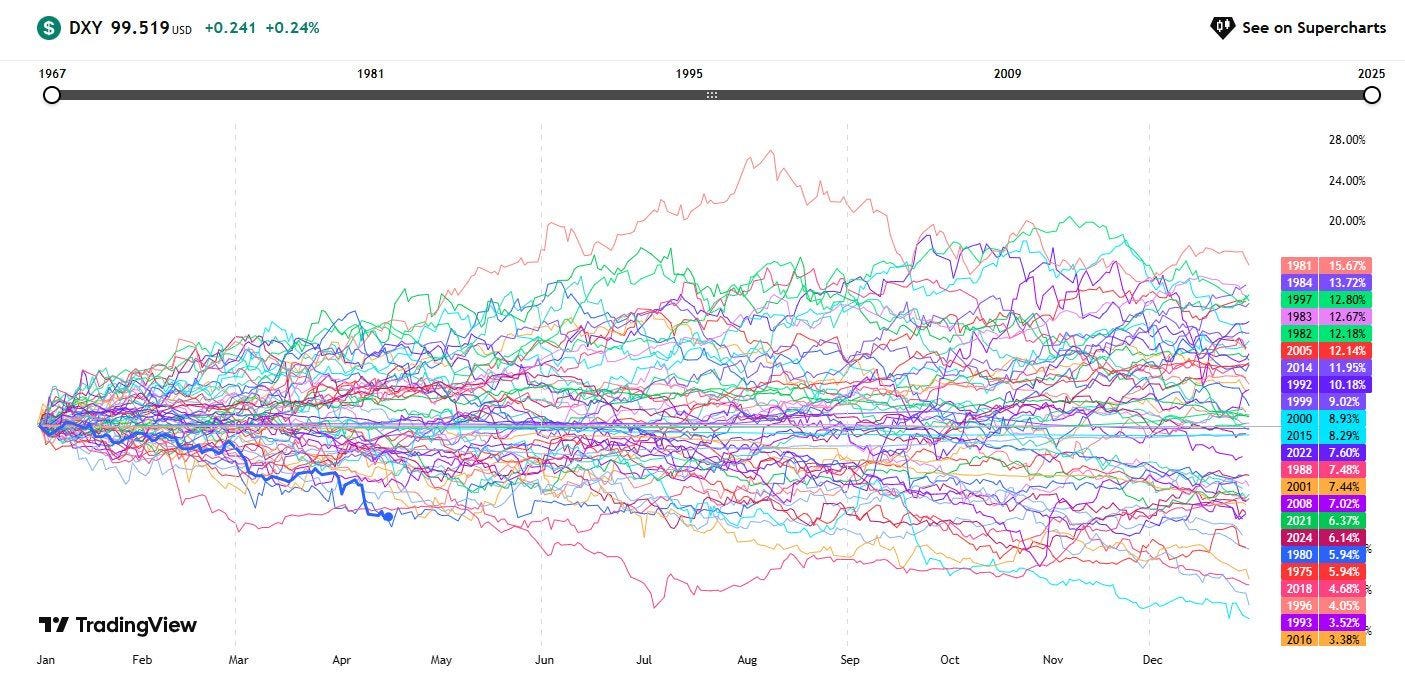
If you thought only the US equity markets underperformed, then the FX enthusiasts/ traders got the shock of their lifetime this month.
Dollar Index (DXY) witnessed the second-worst start of the year since 1967!!!
DXY crashed by more than 10% YTD as the Trump tariff announcement led to the outflow of billions of dollars from US markets.
Furthermore, the massive deleveraging across the FX, bond, and equity markets caused the greenback to witness such a ferocious selloff.
Nothing got spared from the panic selling that gripped the financial markets.
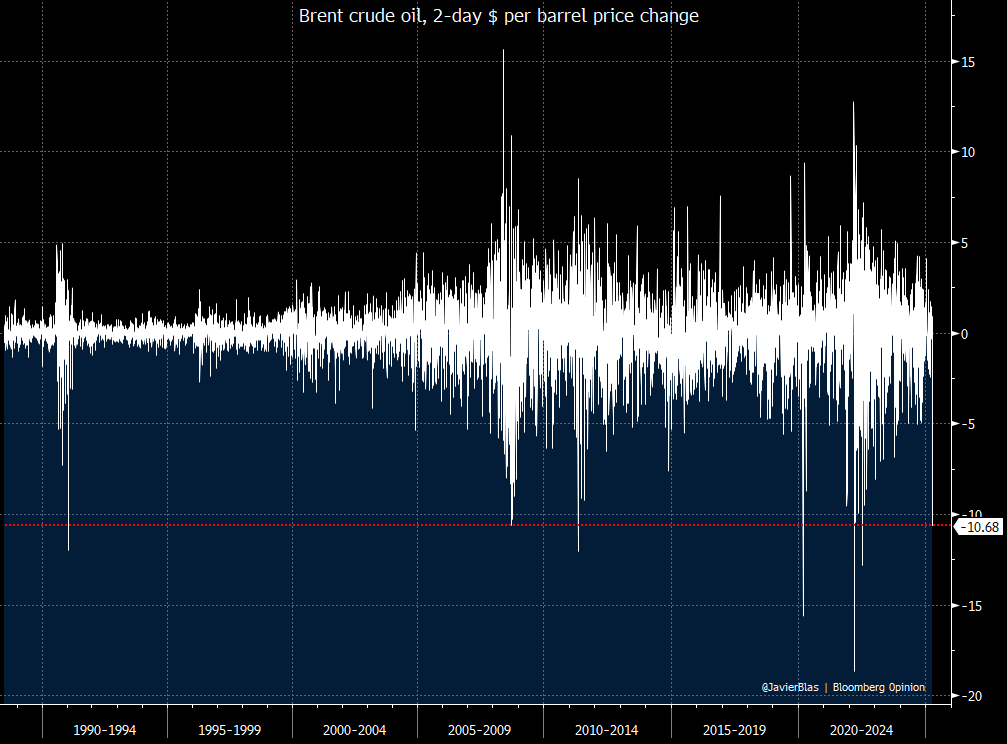
Brent crude fell by over $10 a barrel in less than 48 hours.
It was the 8th largest 2-day absolute price movement ever. Only 2020 (COVID-19 and Saudi price war), 2022 (Russia-Ukraine), 2008 (financial crisis) and 1991 (Gulf War) have seen larger down moves.

Source: BBG
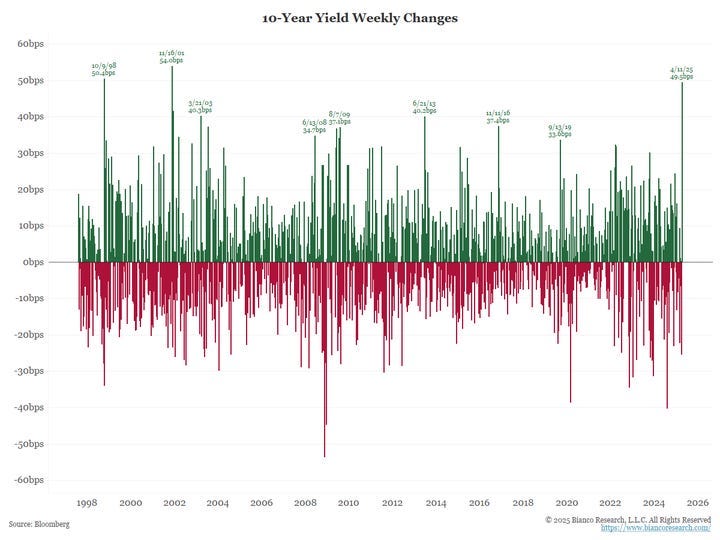
Several decades-old records were smashed in the US bond markets in April.
The 30Y UST saw its largest move since 1982.
The 10Y saw a monstrous move of 51 bps, the largest weekly move since 2001.

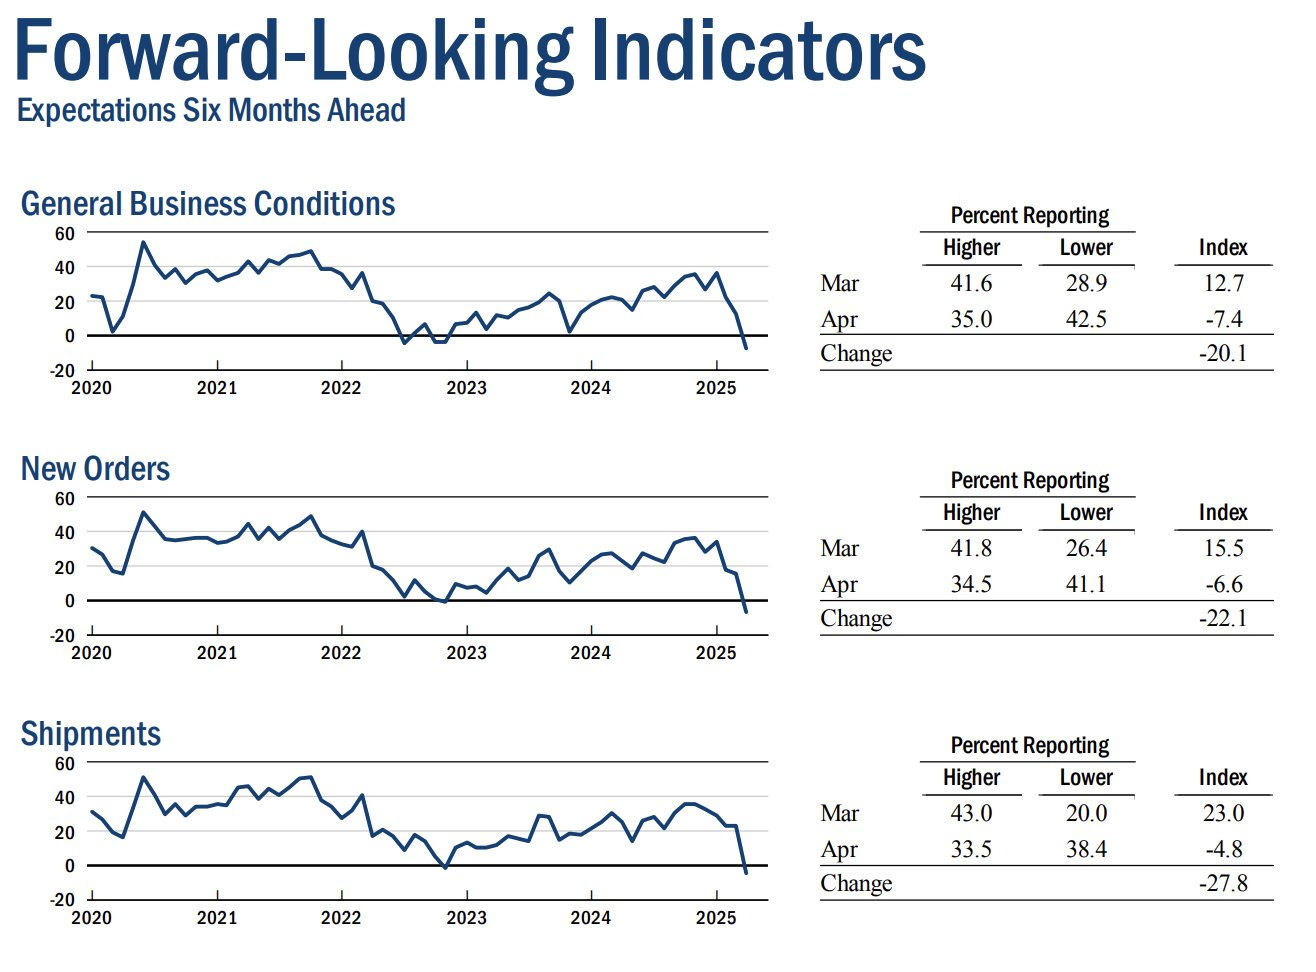
Source: Bianco Research Talking about macro, the Great Tariff Shock ™ has led to extreme weakness in soft data (surveys) as consumer and business sentiment has nosedived.
According to the Philly Fed Survey, "New orders fell sharply, from 8.7 in March to -34.2, its lowest reading since April 2020.”
We can safely conclude that the data is comparable to a global shock akin to the GFC/ COVID-19.

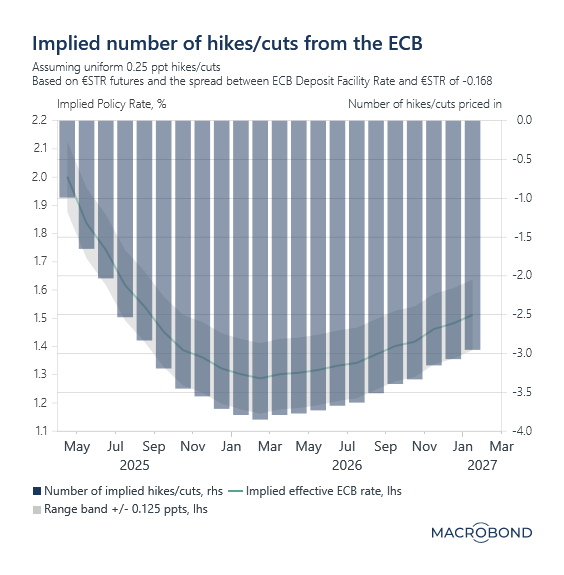
ECB cut rates for the seventh time in a year due to the crumbling growth prospects resulting from the Great Tariff Disruption™.
Due to the dovish ECB, the market now expects further 65 bps of cuts before the end of 2025.
Furthermore, interestingly, the ECB expects tariffs are a negative demand shock.

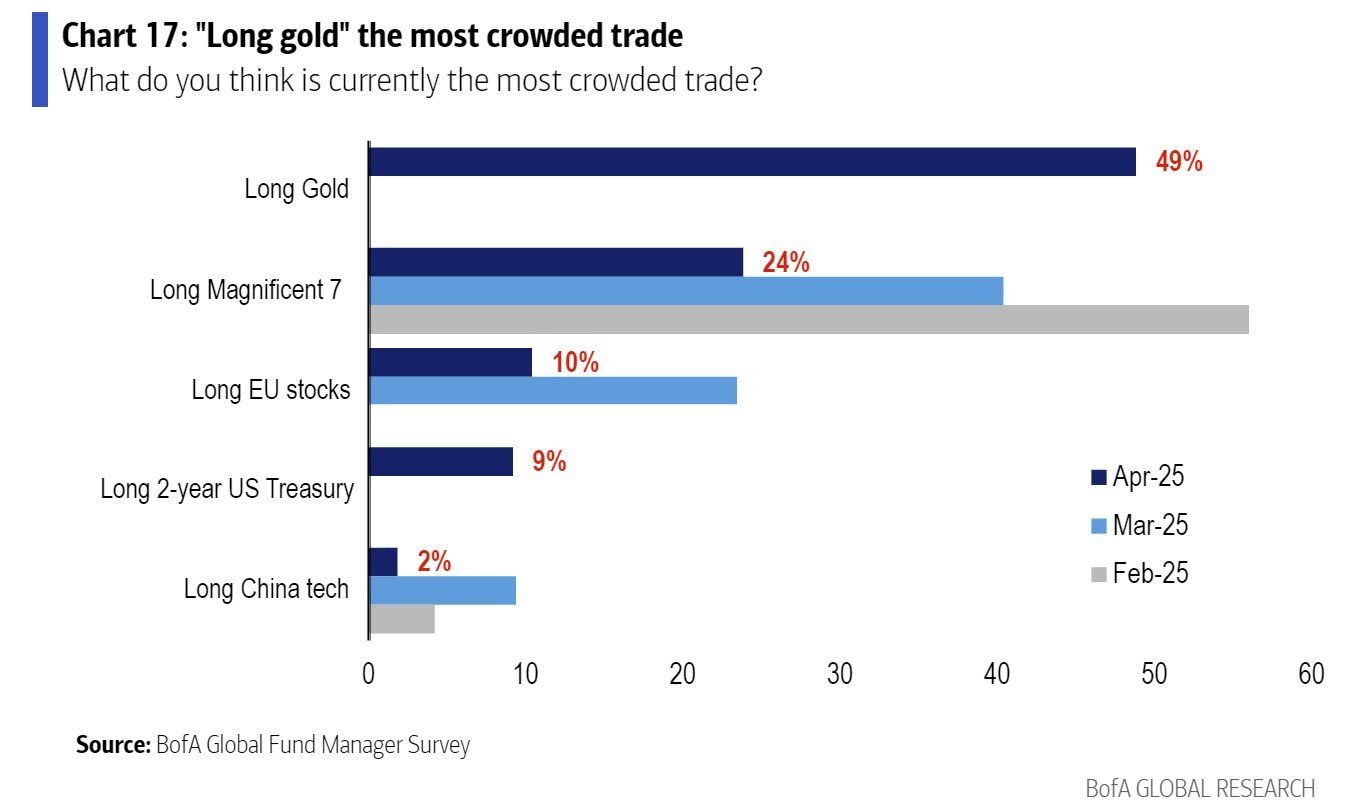
As uncertainty climbed to unprecedented levels, where did the liquidity move to?
Well, yes, it was Gold and EU stocks/bonds.
Thus, as you read this newsletter, we are unsurprised that DAX is just 2-3% from its ATHs.
Surreal!!

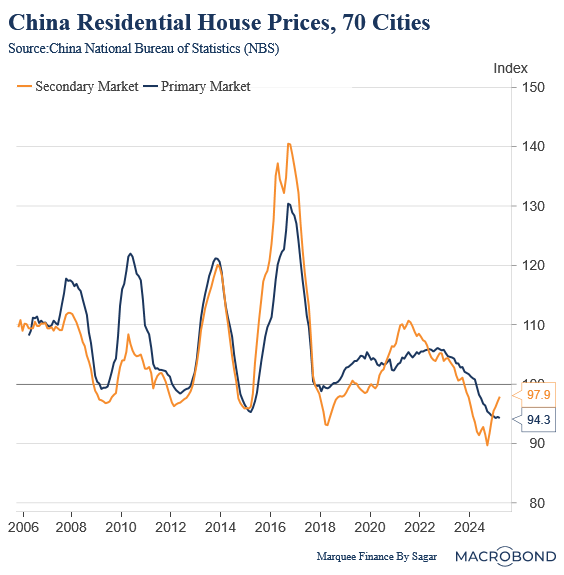
The Great Tariff Shock came at an unfortunate time for the Chinese economy, which was indicating some signs of bottoming out.
There has been a profound recovery in residential house prices in the secondary market as the inventory of completed units reduces and sales activity climbs.

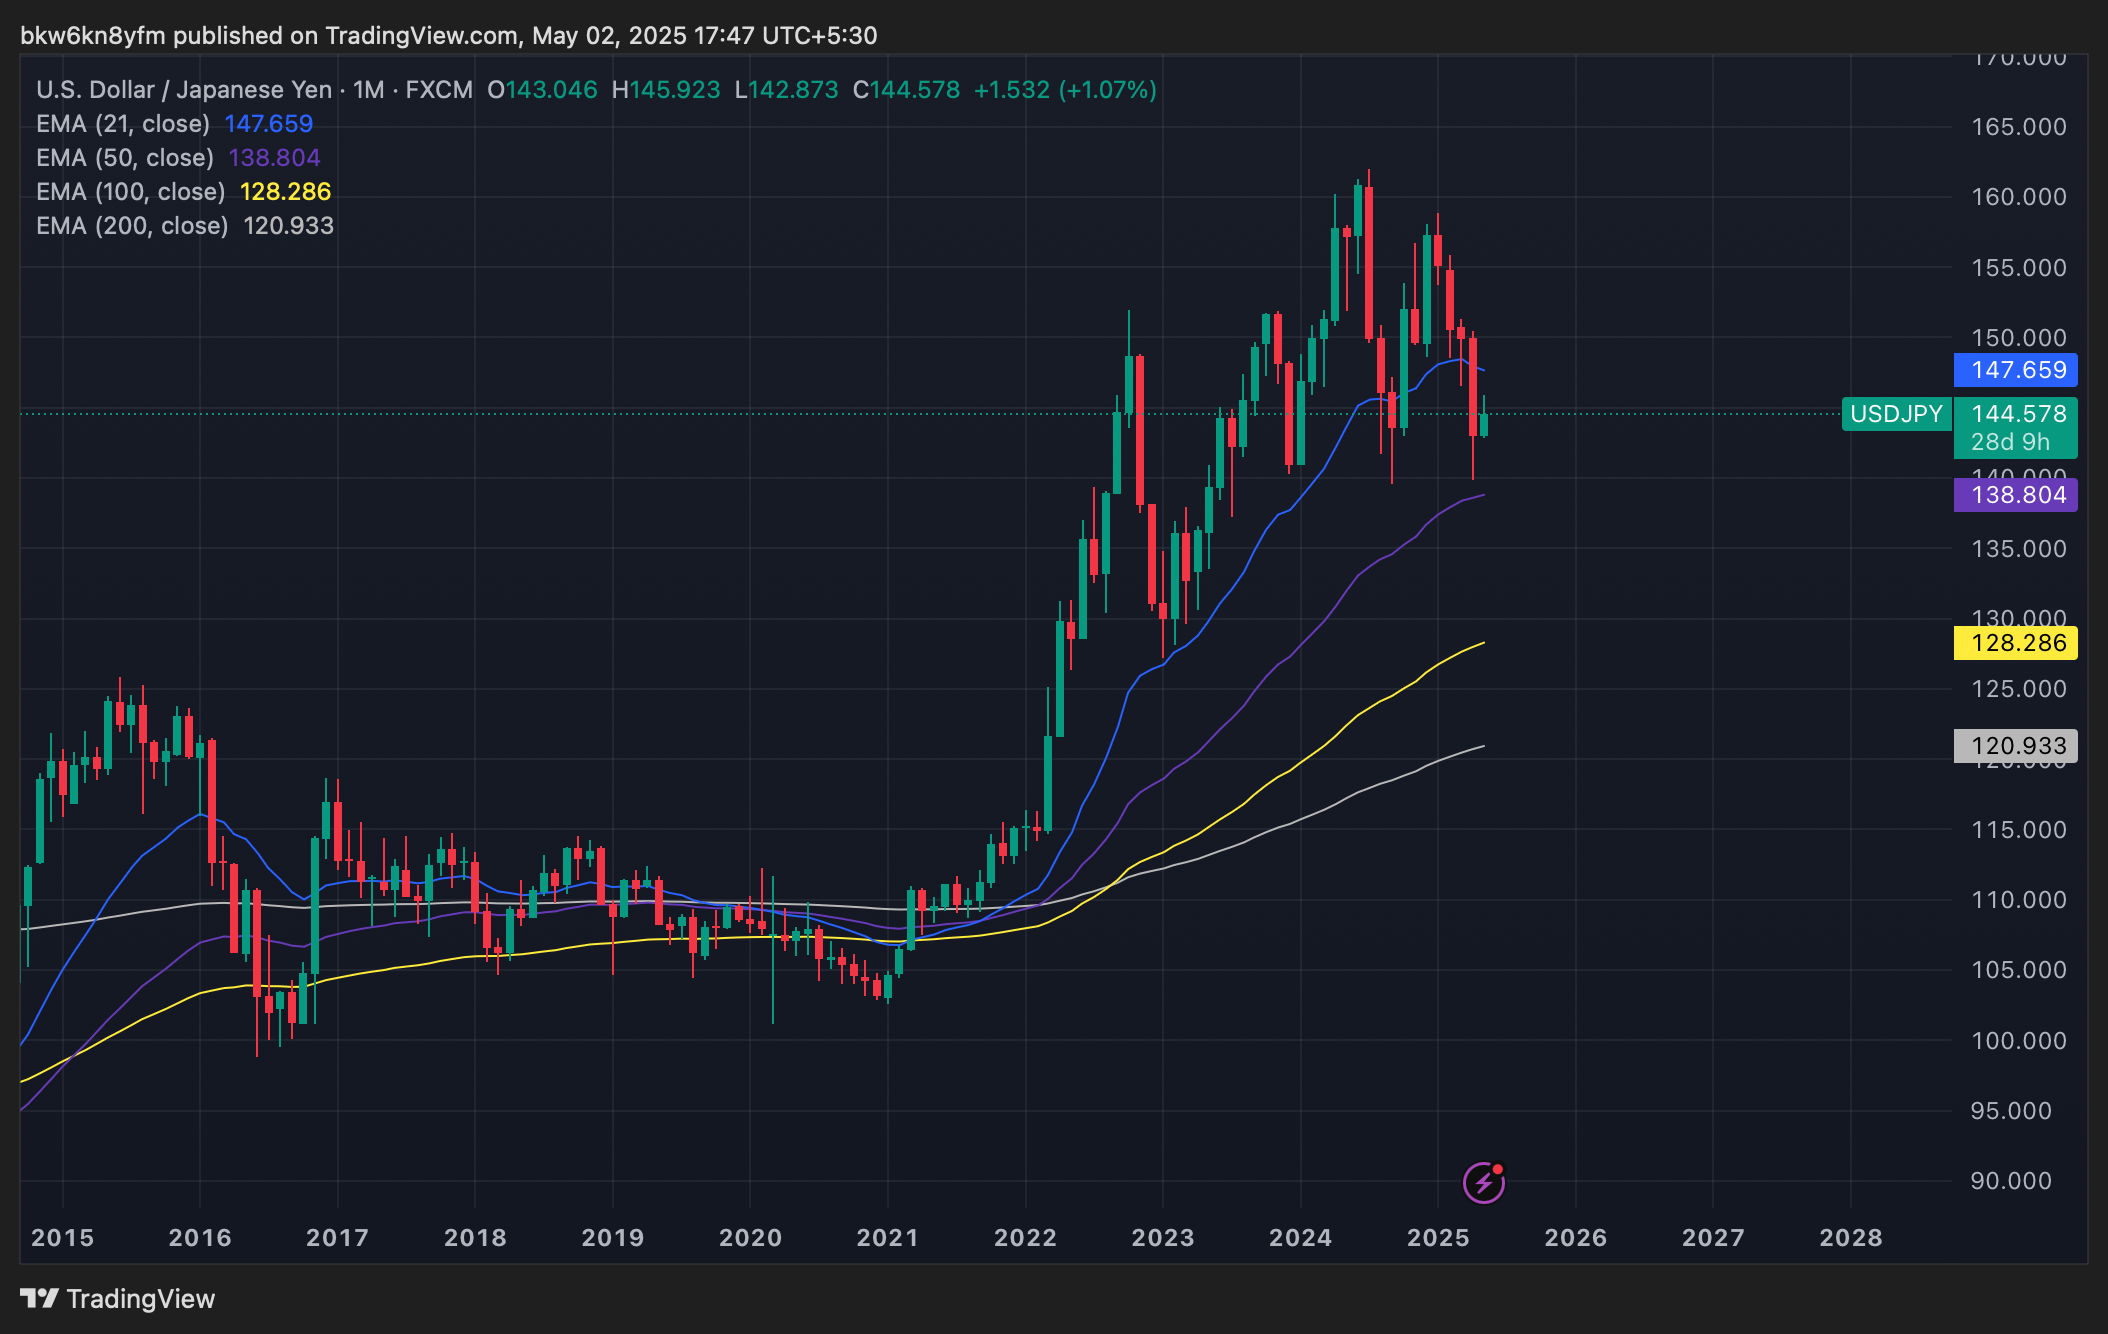
In the land of the rising sun, USDJPY fell by 4.5% in April (though it recovered from the lows).
There were rumours of a reversal of carry trades in the FX markets.
As BOJ remains dovish despite sticky inflation, citing tariff uncertainty, one must be cautious while trading the FX markets.

BONUS CHART: Gold market implied volatility (a common exhaustion indicator that suggests a period of consolidation) shot to the levels seen at the peak of the historical bull market.
Will this time be different, or will new highs be possible this year?
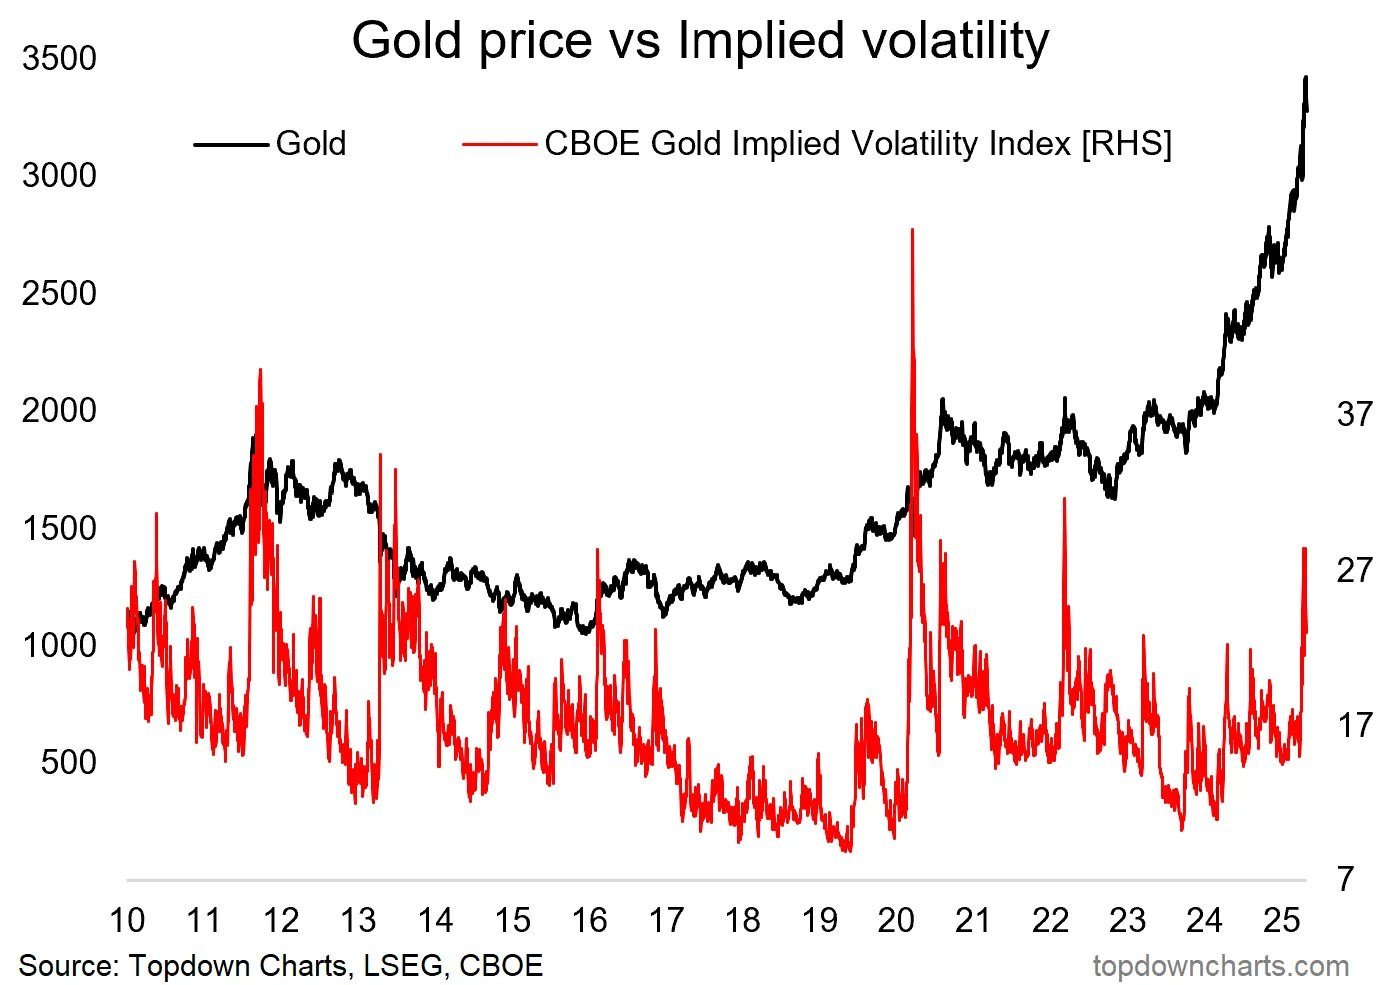
Source: Topdown charts

Disclaimer
This publication and its author is not a licensed investment professional. The author & any other individuals associated with this newsletter are NOT registered as Securities broker-dealers or financial investment advisors with the U.S. Securities and Exchange Commission, Commodity Futures Trading Commission, or any other securities/regulatory authority. Nothing produced under Marquee Finance by Sagar should be construed as investment advice. Do your research and contact your certified financial planner or other dedicated professional before making investment decisions. Investments carry risk and may lose value; Marquee Finance By Sagar LLC, Marqueefinancebysagar.substack.com or Sagar Singh Setia is not responsible for loss of value; all investment decisions you make are yours alone.