


Portfolio Update: May 2025!

There is an adage in equity markets: “Sell in May and go away!”
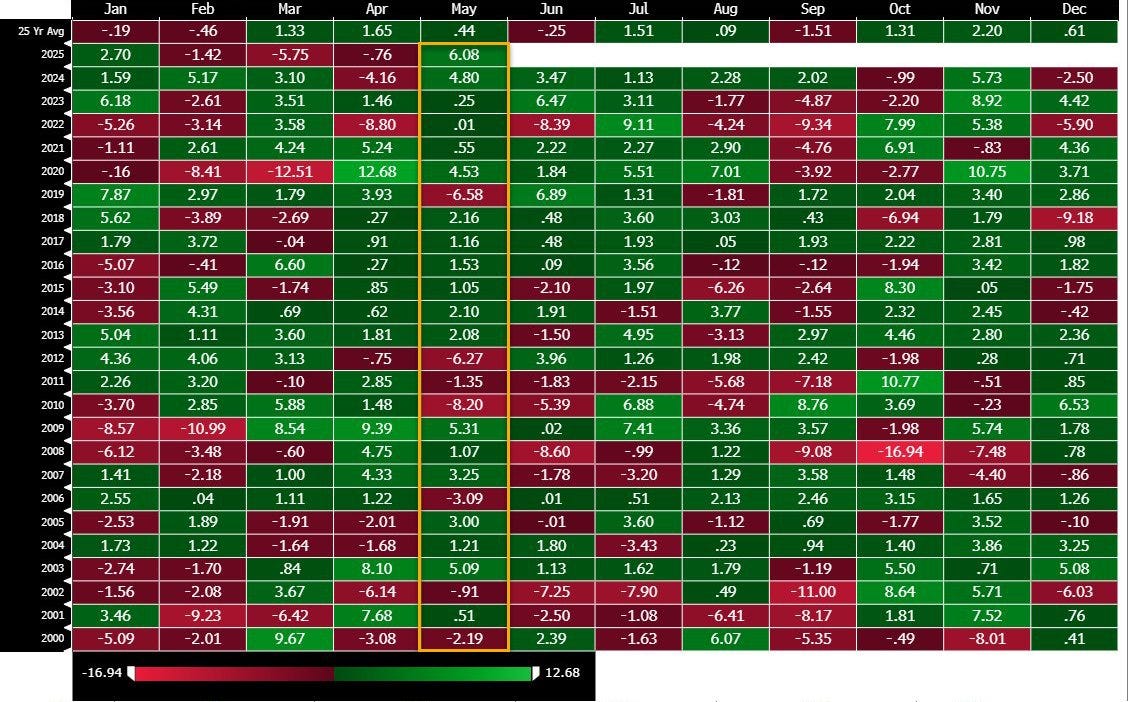
However, market participants who sold early in May, after a blistering rally from April lows, missed one of the best May returns since 1990!
Yes, folks, May 2025 was the best in the last 25 years as the S&P 500 was up by more than 6%.
While the equity markets rebounded with a vengeance, the bond markets, led by Japan, experienced a global panic attack.
The Dollar Index and Gold experienced wild swings, but closed absolutely flat MoM.
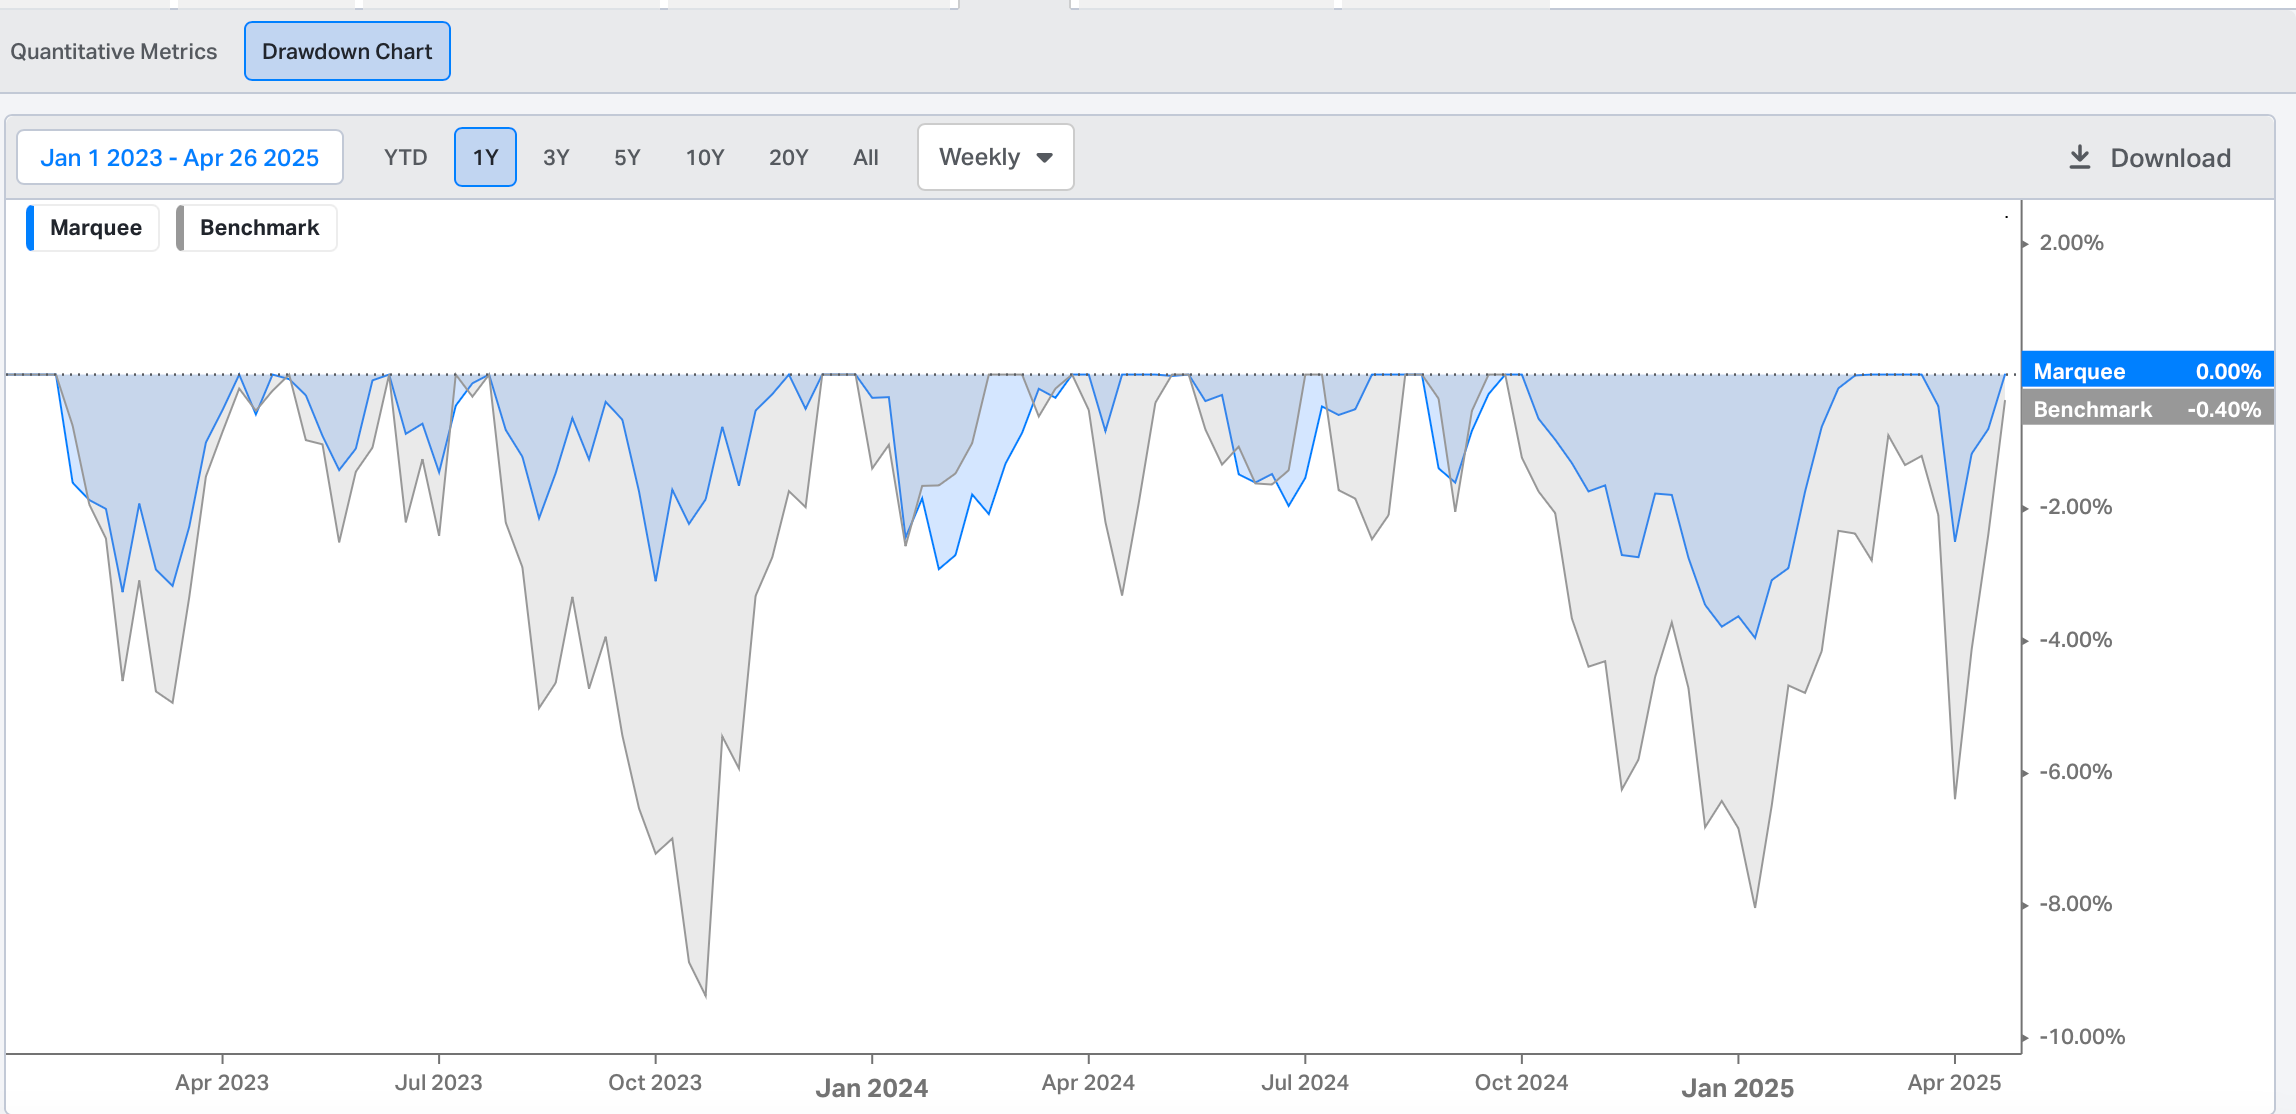
Thanks to our substantial dip buying in April, we have had a fabulous May, where our PF was up by more than 3.5%.
As a result, we are now up 12.5% in the first five months of 2025 and are on a track to deliver double-digit returns this year.

Furthermore, we have experienced limited and shallow drawdowns, thanks to our high cash allocation during turbulent times over the last three years.
Note that we are down only 20 bps from the top.
Let’s begin today’s newsletter by briefly comprehending this week’s macro data and then jump to our performance and asset allocation strategy!
Macro Data!
The two most important macro releases in the US this week were the Personal Income and Spending reports.
Let’s begin with Personal Income. When we zoom out from the monthly noise, we have a sordid state of affairs in the US.
The Real Personal Disposable Income (Adjusted for inflation) remains below the trendline five years after the deadly pandemic and the trillions of dollars in stimulus.
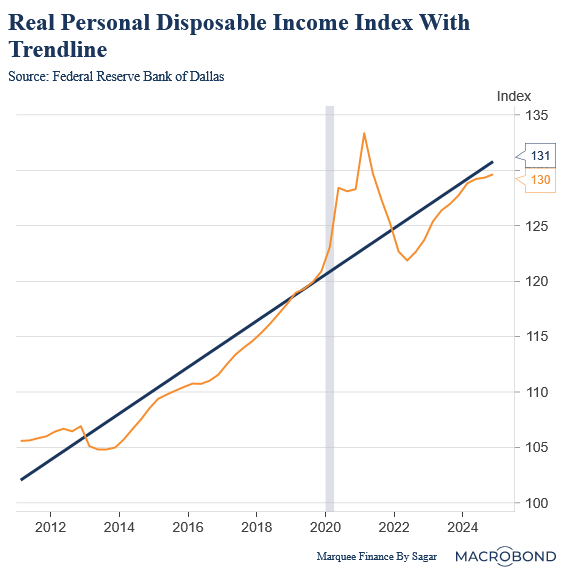
There is a discrepancy with the lower-income households suffering, as indicated by the high frequency indicators that we discussed last week, and then we have higher income households (and asset holders)/ the top 5%, to say who are still spending due to buoyant asset prices and positive wealth effect.
As a result, we are witnessing a K-shaped recovery, which may worsen if interest rates remain high and the macro outcome for the economy is stagflation.
Moving on, the Fed’s preferred gauge for tracking inflation is the PCE, which came in line with estimates, with the headline index at 2.2% YoY and the Core PCE at 2.5% YoY.
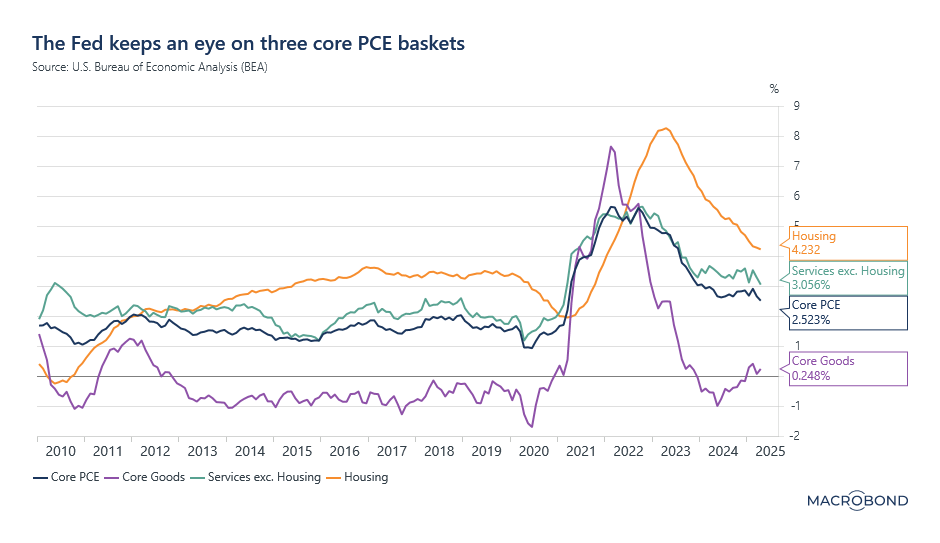
Upon examining the internals, the trend in Services Ex-Housing is encouraging, as the measure has reached its lowest point since 2021.
Nonetheless, Core Goods have begun to rise albeit on a low base.
Furthermore, this is before we have witnessed the impact of tariffs on inflation. We have previously mentioned that there will be a considerable lag in the inflation data as it will take at least a quarter or so for tariffs to appear in inflation data (this is “IF” companies do pass on the tariffs to consumers whether partially or wholly).
However, there is one tool by which we can almost accurately predict the upcoming rise in inflation.
Keep reading with a 7-day free trial
Subscribe to Marquee Finance by Sagar to keep reading this post and get 7 days of free access to the full post archives.