


The Trigger?

“Inflection points come in all forms: positive, negative, easy, hard, obvious, and subtle. The way you respond – whether you grab hold of an inflection point and leverage it for all it’s worth or just let it carry you along – is as important as the event itself.”- Eric.C. Sinoway.
The biggest headline of this week came in as the markets closed yesterday. Yes, we are talking about Moody’s downgrade of the US Sovereign rating.
If you zoom out and look at the broader picture, the downgrade is nothingburger as the other two influential rating agencies (S&P and Fitch) have already downgraded US debt in the past several years.
Nonetheless, sometimes, when the markets are at an inflection point, they need a “trigger”, such as news that changes the direction or causes a trend reversal.
In markets and often in life, there can’t be 100% certainty about the future, as various forces act in tandem that can’t be predicted. Thus, one needs to take a high probability trade/investment which is determined via the framework which one can establish after years of experience.
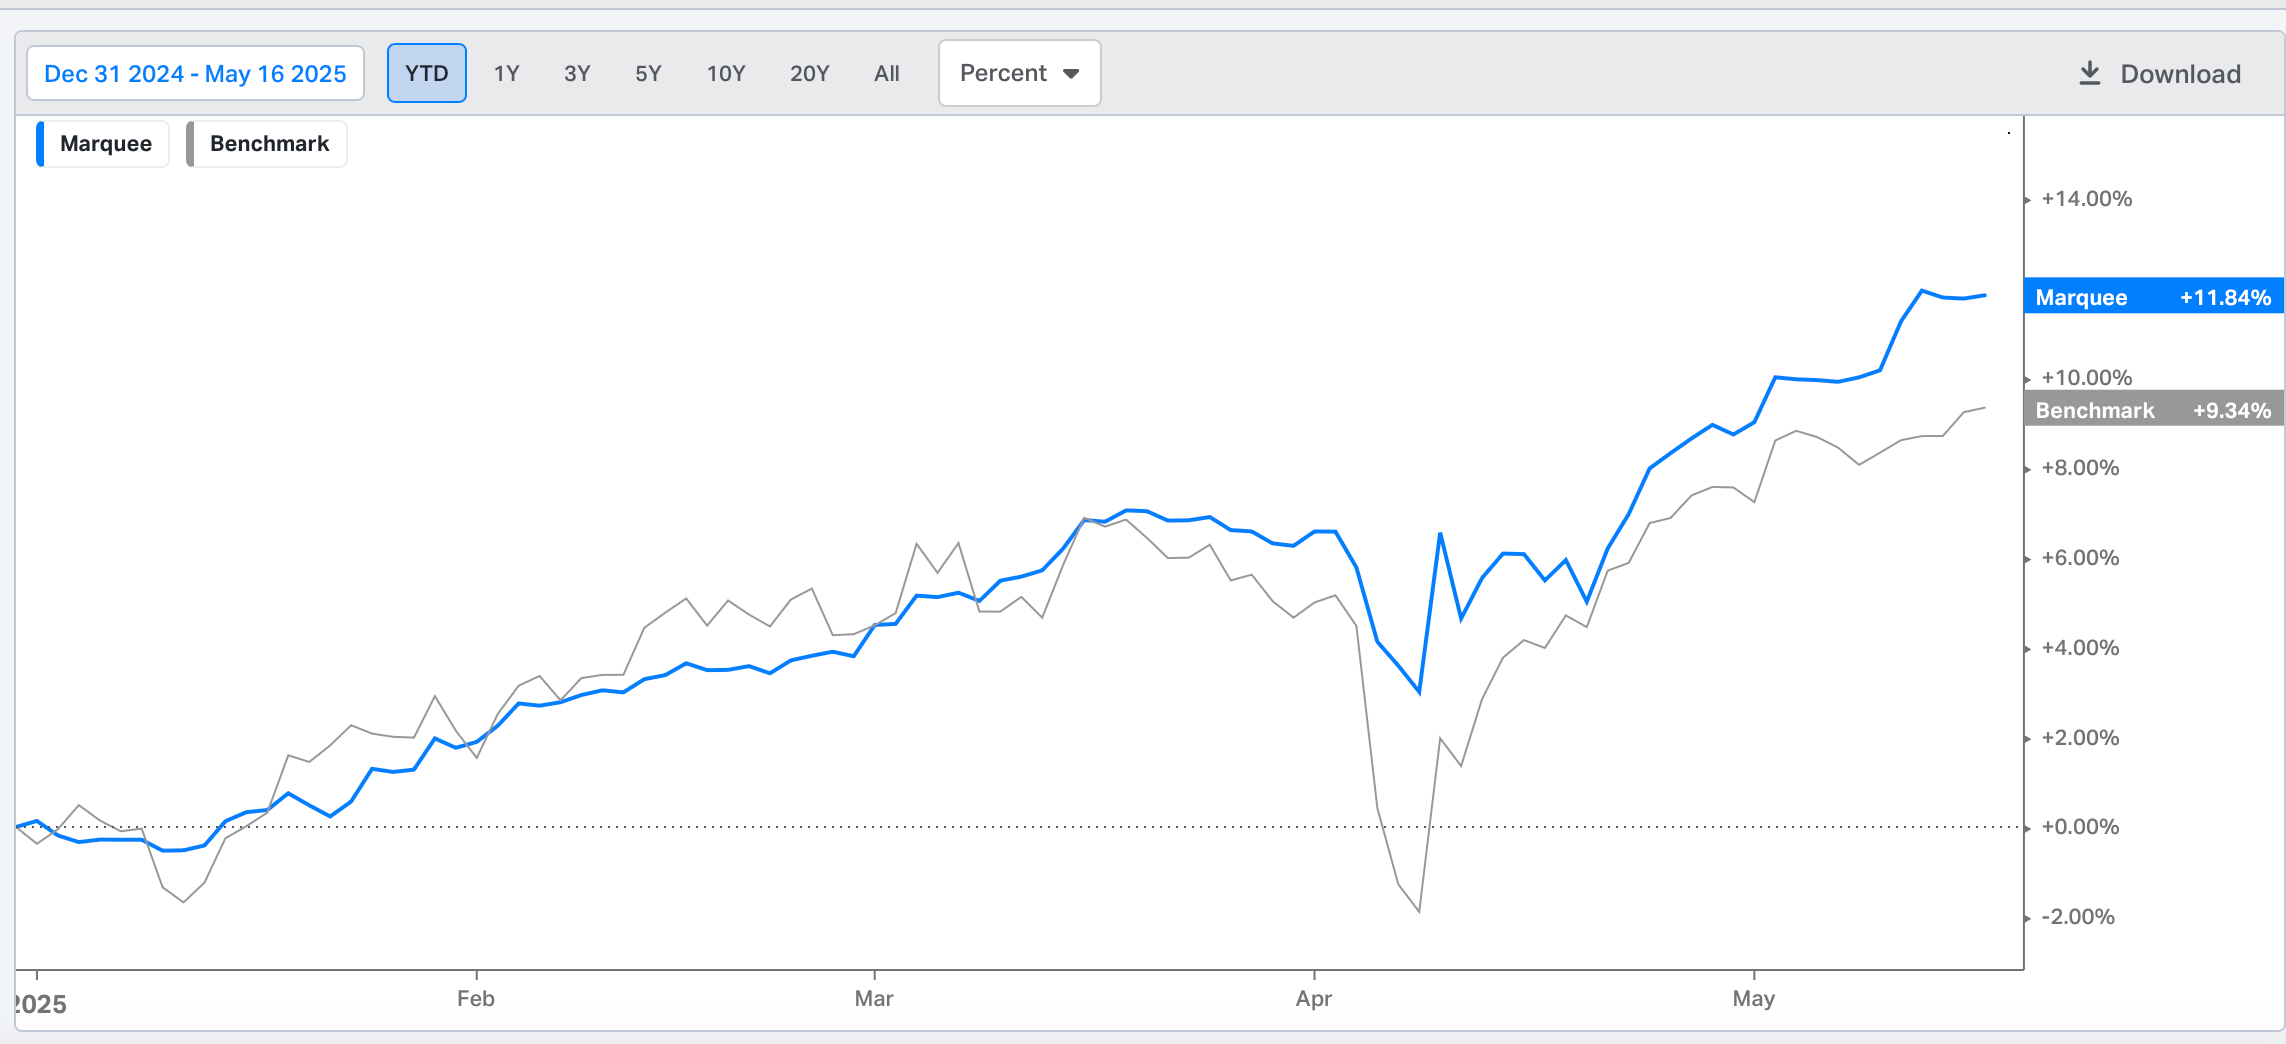
Incorporating technical analysis into our framework over the past few months has drastically improved our performance.
We are up 11.84% YTD and beating the benchmark (60% MSCI ACWI Ex-US and 40% BBG Global Aggregate) by more than 250 bps as of yesterday.
This week began with the historic press conference in Geneva, and then the macro data (CPI, PPI, Retail Sales, etc.) began to flow throughout the week.
Trump’s visit to the Middle East and shaking hands with the newly appointed Syrian President, who was one of the most wanted men last year with a $10 million bounty, was another chapter in history which will be remembered for decades by those who study geopolitics in depth.
Then, we also had Russian and Ukrainian delegations meeting in Istanbul, the first time both countries have sat at a negotiating table since the war began.
All in all, many events transpired this week, and we expect more to come in the next few weeks as the world changes forever under the Trump presidency.
Let’s begin today’s newsletter by comprehending the global macro data and cross-asset movements in detail!
US/ Gold/ Dollar/ Oil!
Let’s begin with the Producer Price Index (PPI), a barometer that market participants track closely. It (and the CPI/PPI spread) has historically been related to corporate margins/profitability.
The PPI came in softer than expected, with the headline number at -0.5% MoM v/s expectations of 0.2%. Furthermore, the Core PPI came in at -0.4% MoM v/s expectations of 0.3%.
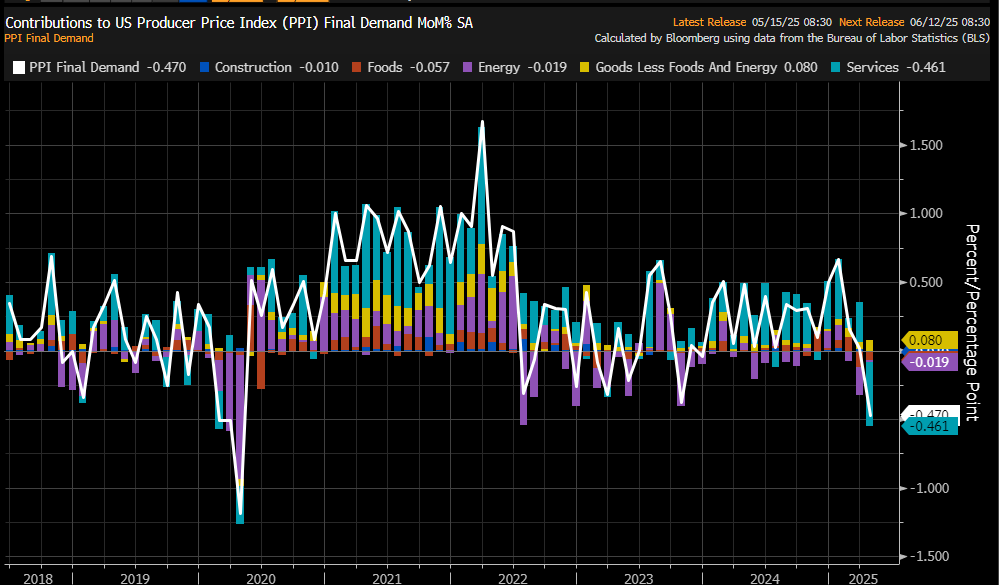
The weakness can also be explained by a big drop in portfolio management fees due to the massive selloff in equity markets.
Before we move on to CPI, we must remember that CPI and PPI are lagging indicators, and any softness in inflation data suggests a “weakening” economy.
CPI also came in softer than expected, with the headline number at 0.2% MoM v/s the expectation of 0.3% MoM. Core CPI was at 0.2% v/s 0.3% expectation.
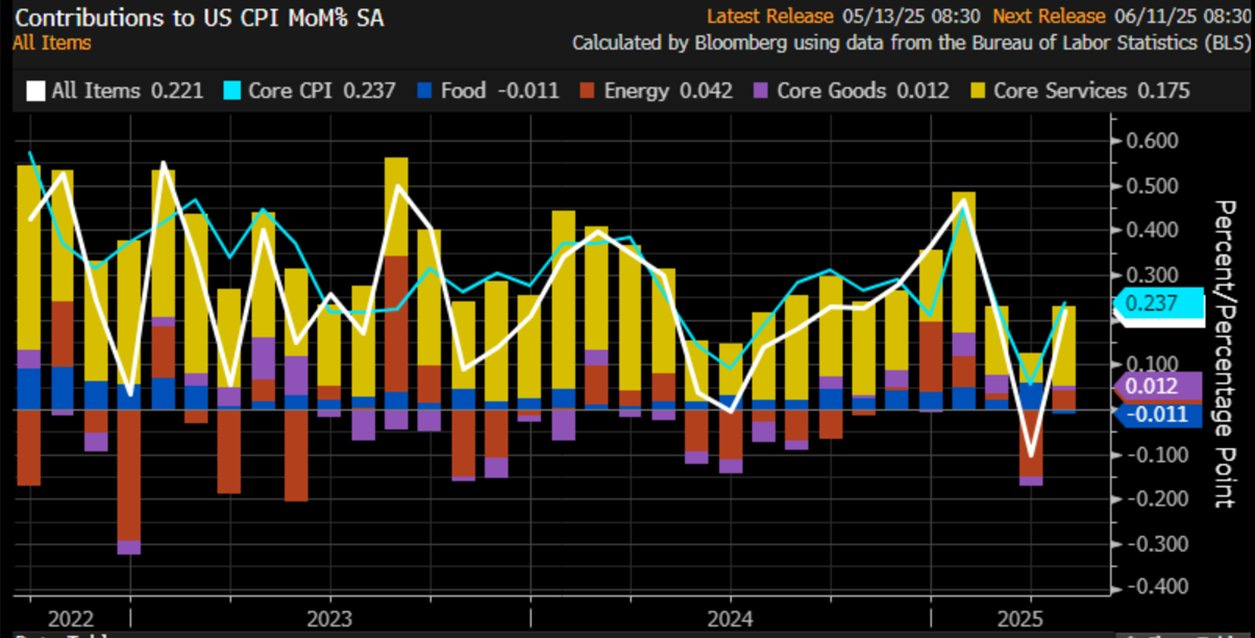
Note that we have not yet witnessed the full impact of tariffs, as it takes time for the higher prices to flow into the data.
The Supercore CPI (Services Ex-Shelter), which JayPo popularised during the rate hike cycle, came in at 0.209% MoM and 2.743% YoY.

Though it has come off considerably from the highs, it remains sticky, and we need a number below 2.5% to make the Fed comfortable.
Our model indicates that with the current trends, the CPI will…
Keep reading with a 7-day free trial
Subscribe to Marquee Finance by Sagar to keep reading this post and get 7 days of free access to the full post archives.